Hello Friends!
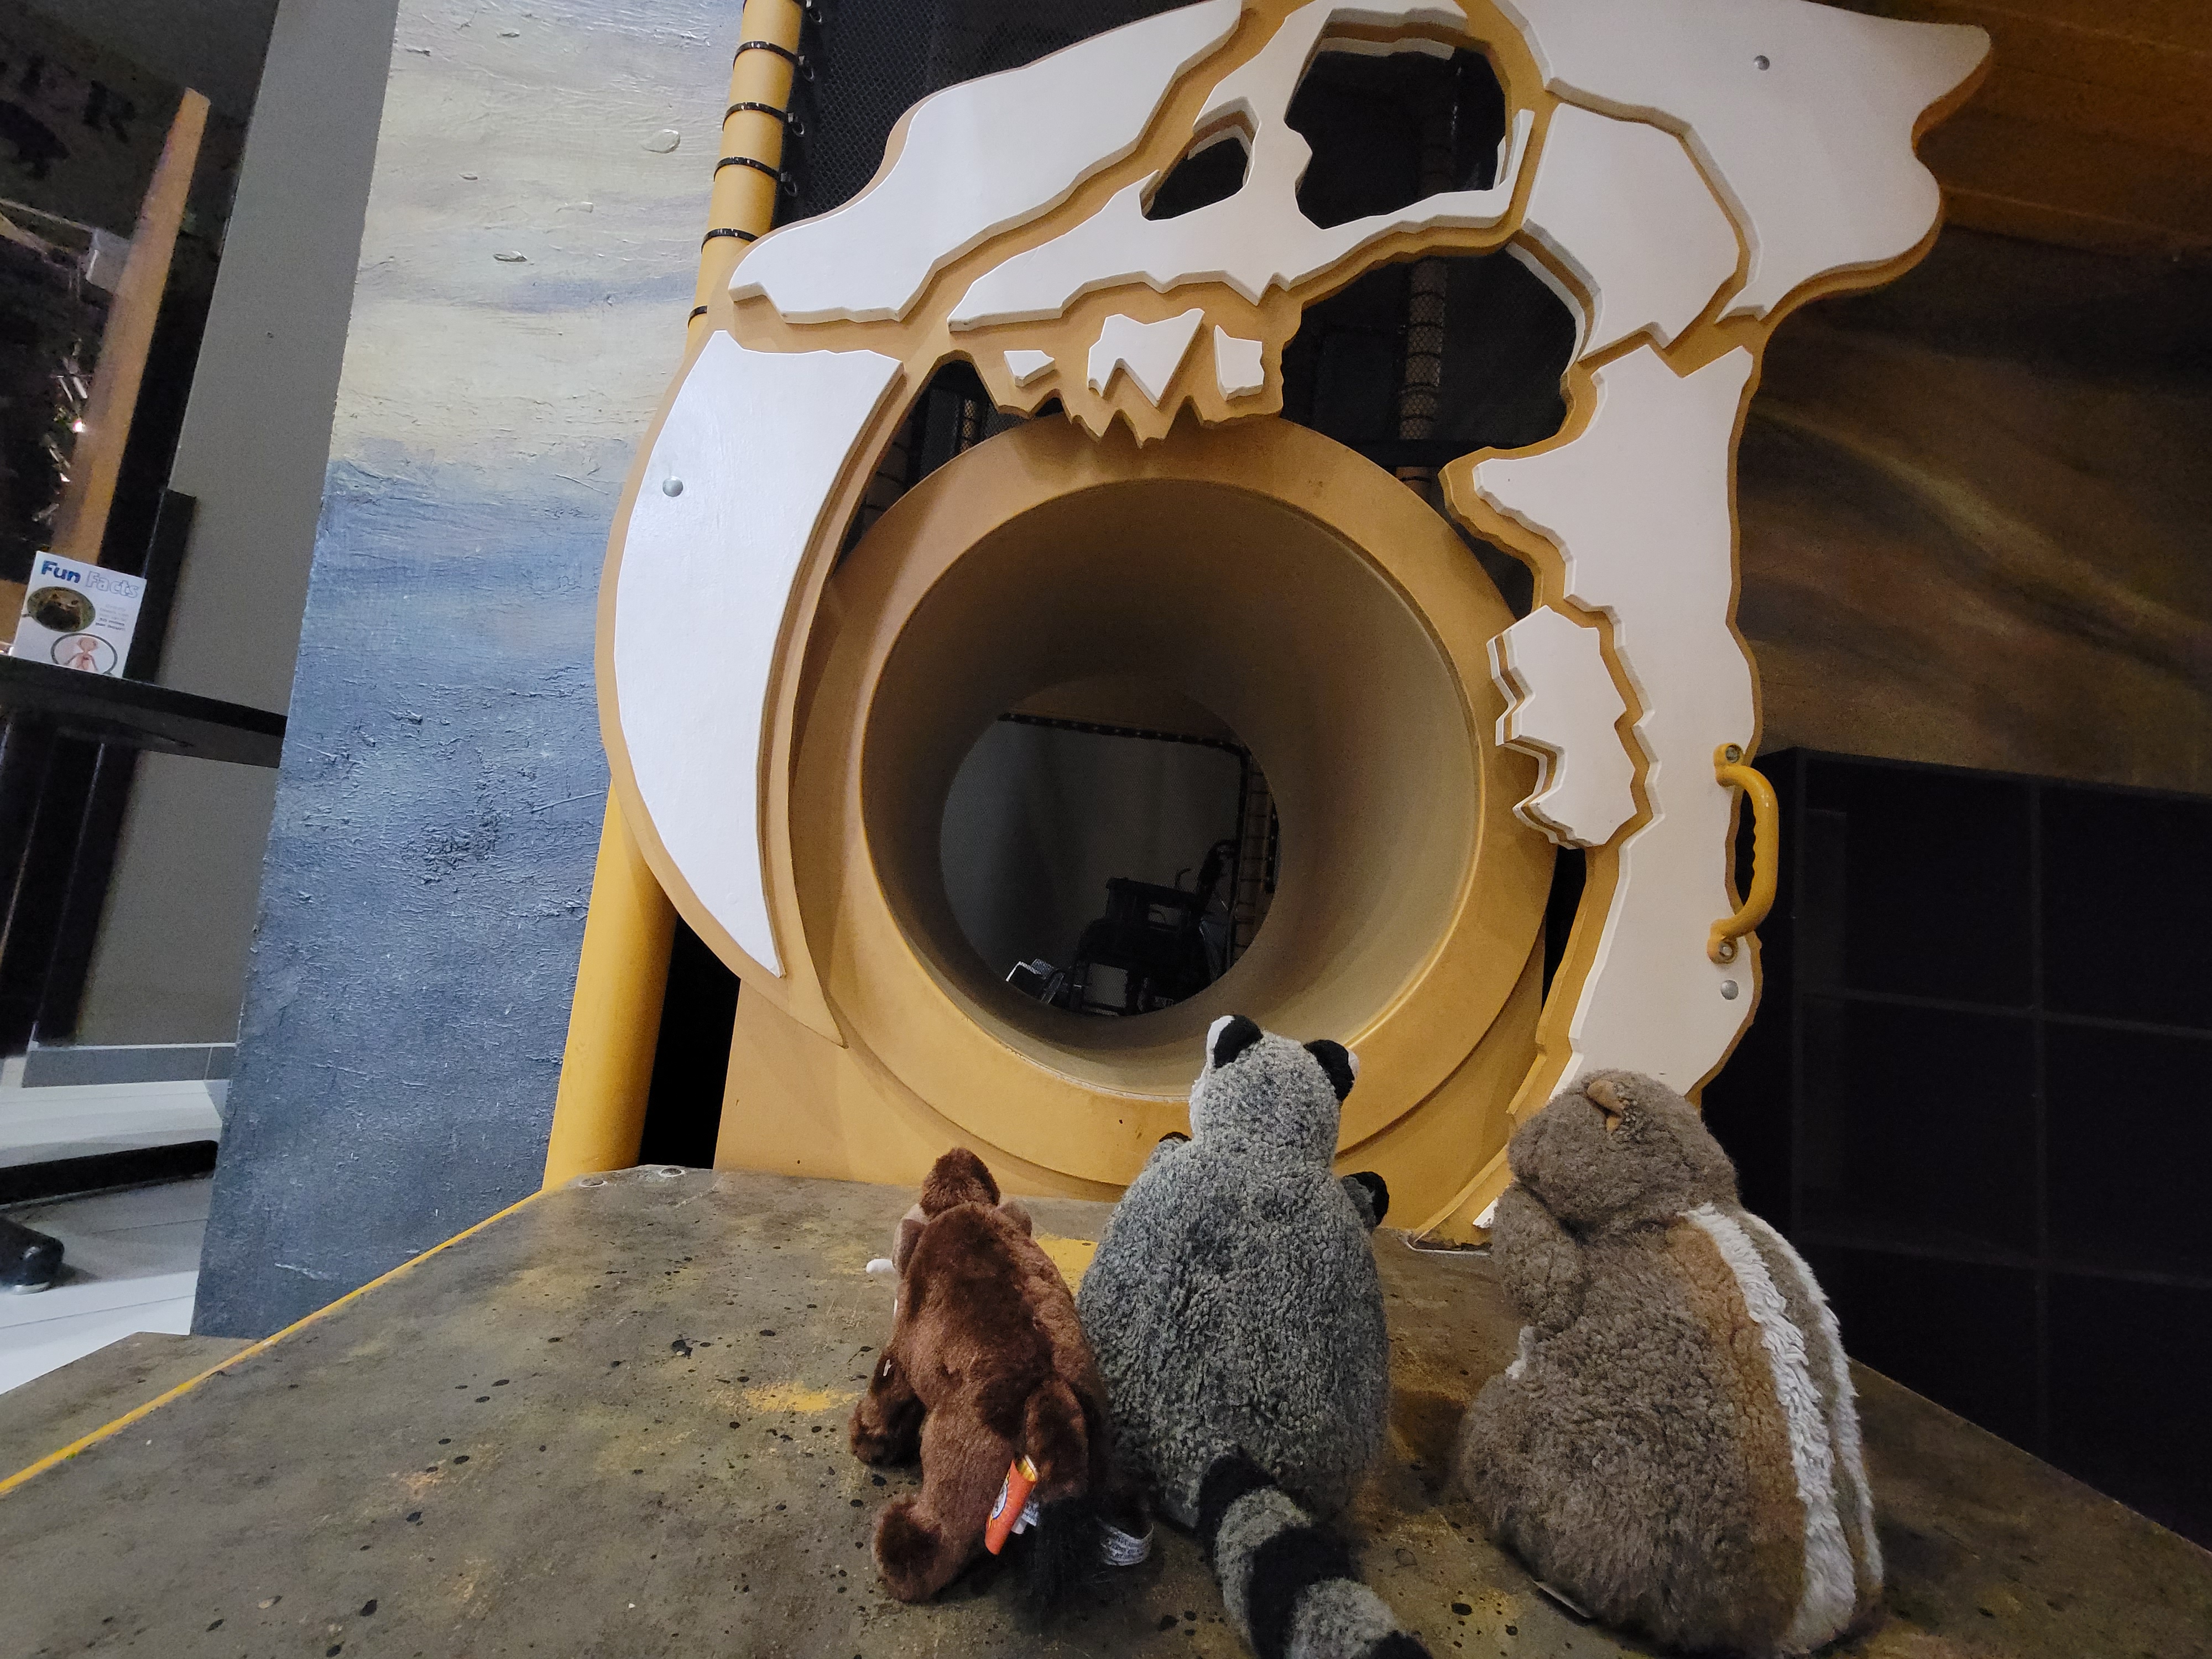
Today we get to be paleontologists!
Um KoonKoon, I don’t want to give up dairy, I love cheese WAY too much!
No ChipChip, not the Paleo Diet, we are going to be paleontologists. They are the super cool scientists who dig up ancient treasures called fossils. Don’t worry, brie happy and watch this video, it will tell you all you need to know.
Welcome to our first full and comprehensive lesson!
This lesson contains all the materials needed for teachers, parents, and students.
Overview:
Students will embark on an exciting hands-on activity where they become junior paleontologists! They will excavate fossil replicas, measure them accurately, and create line plots to display their findings. This activity integrates math and science concepts, allowing students to explore the world of fossils while practicing measurement and data representation skills.
Grade:
This lesson is aligned to a fourth-grade standard but can easily be adapted for utilization with older or younger children.
Standard:
4.MD.B.4 Make a line plot to display a data set of measurements in fractions of the same unit (1/2 or 1/4 or 1/8). Use operations on fractions for this grade to solve problems involving information presented in line plots. For example, from a line plot find and interpret the difference in length between the longest and shortest specimens in an insect collection.
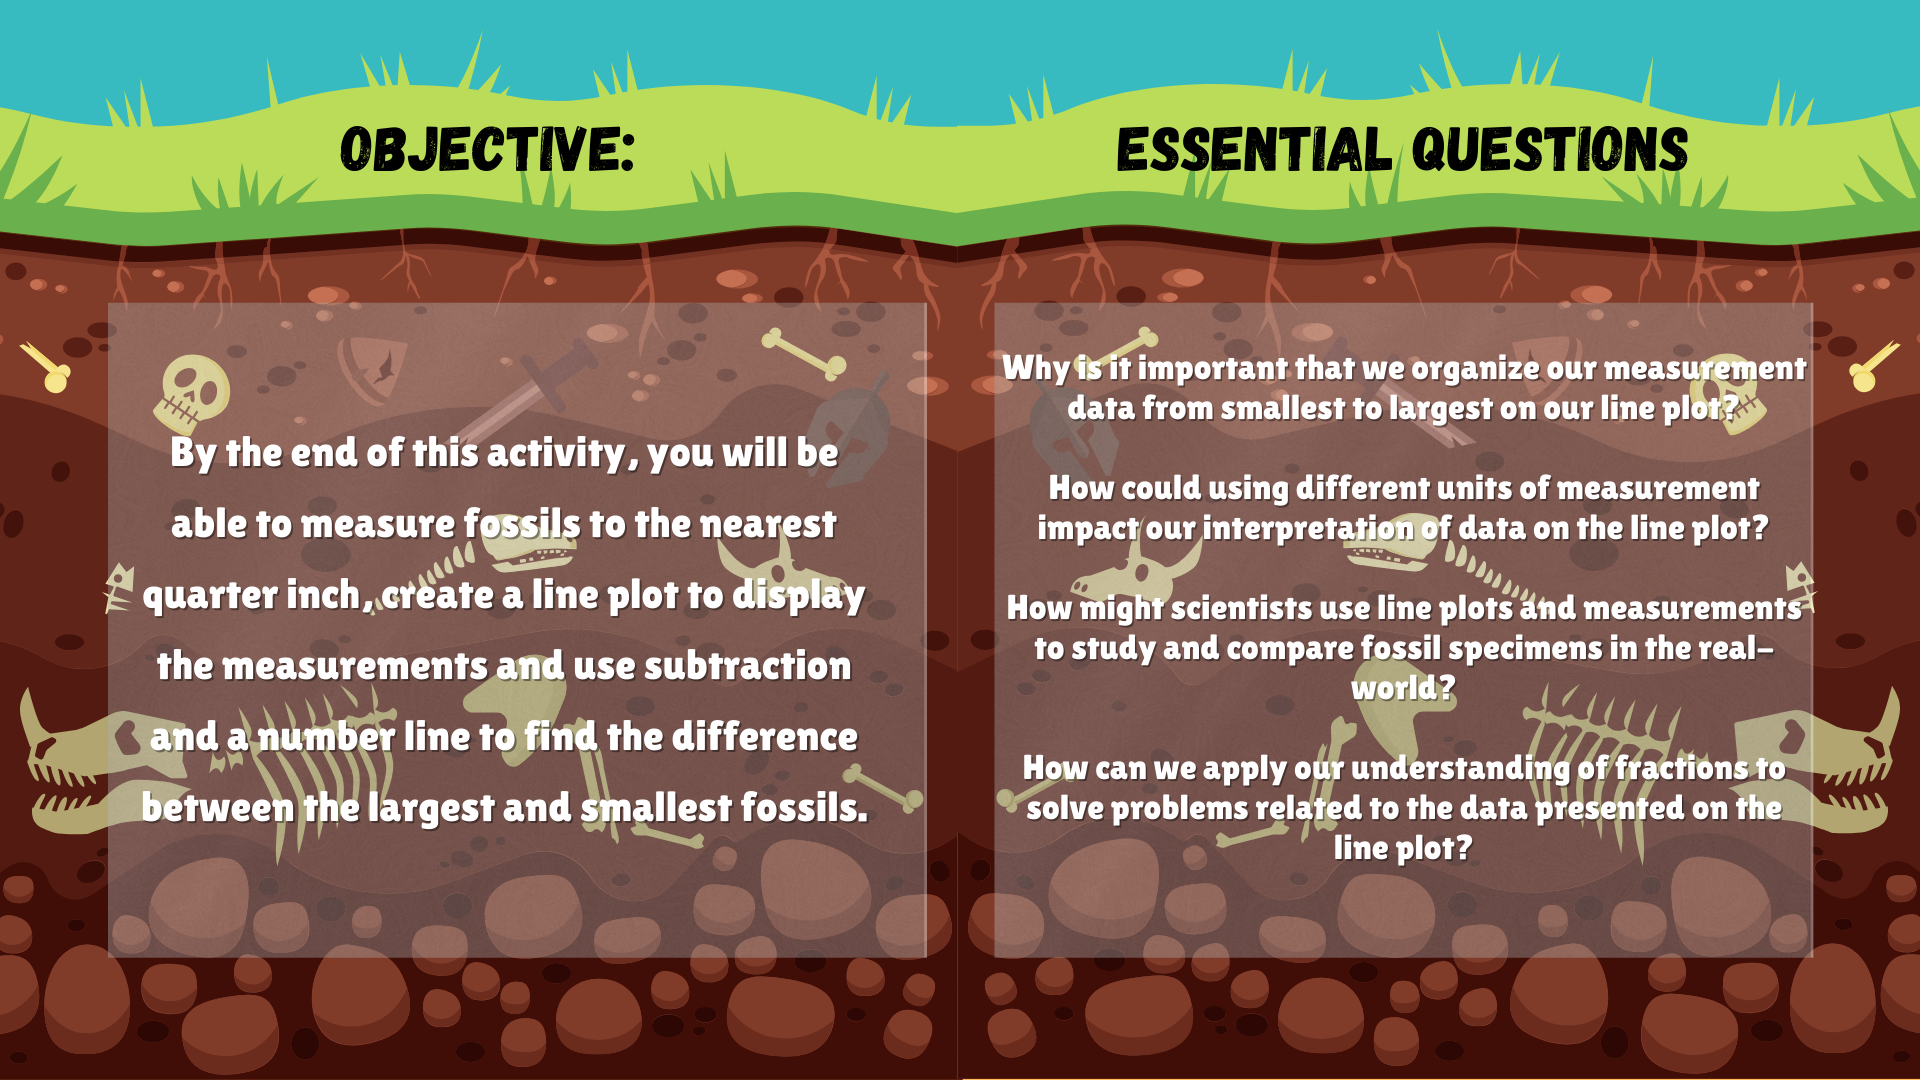
Objective:
- Students will measure (evaluation)the remains they find to the nearest ¼-inch.
- Students will construct (apply) a line plot to map their data.
- Students will present (creating) their graphs to their group mates and explain(analyze)their reasoning behind their graph construction and data distribution.
- Students will determine (apply) the difference in length between the measurement of the longest fossil and the shortest fossil using subtraction and a number line.
Steps:
- Introduction to Fossils:
- View the slide show presentation and view the Can Ya Dig it Adventure Video above (also embedded in the presentation – download below)
- Excavation:
- Students will use excavation tools to carefully dig out fossil replicas from a designated “fossil pit” (a sandbox or container filled with sand or soil – printable fossils can be downloaded below).
- Once a fossil is found, students will brush it off gently and prepare it for measurement.
- Measurement:
- Using rulers, students will measure the length of each fossil to the nearest quarter inch.
- They will record their measurements on the provided lab sheet (download below).
- Creating a Line Plot:
- Students will order and enter their data onto the lab sheet to create a line graph.
- Each fossil measurement will be represented by an ‘X’ or dot above the appropriate value on the number line.
- Data Analysis:
- Students will analyze their line plots to determine the range of fossil sizes (difference between the largest and smallest fossils).
- They will discuss any patterns or trends they observe in the data.
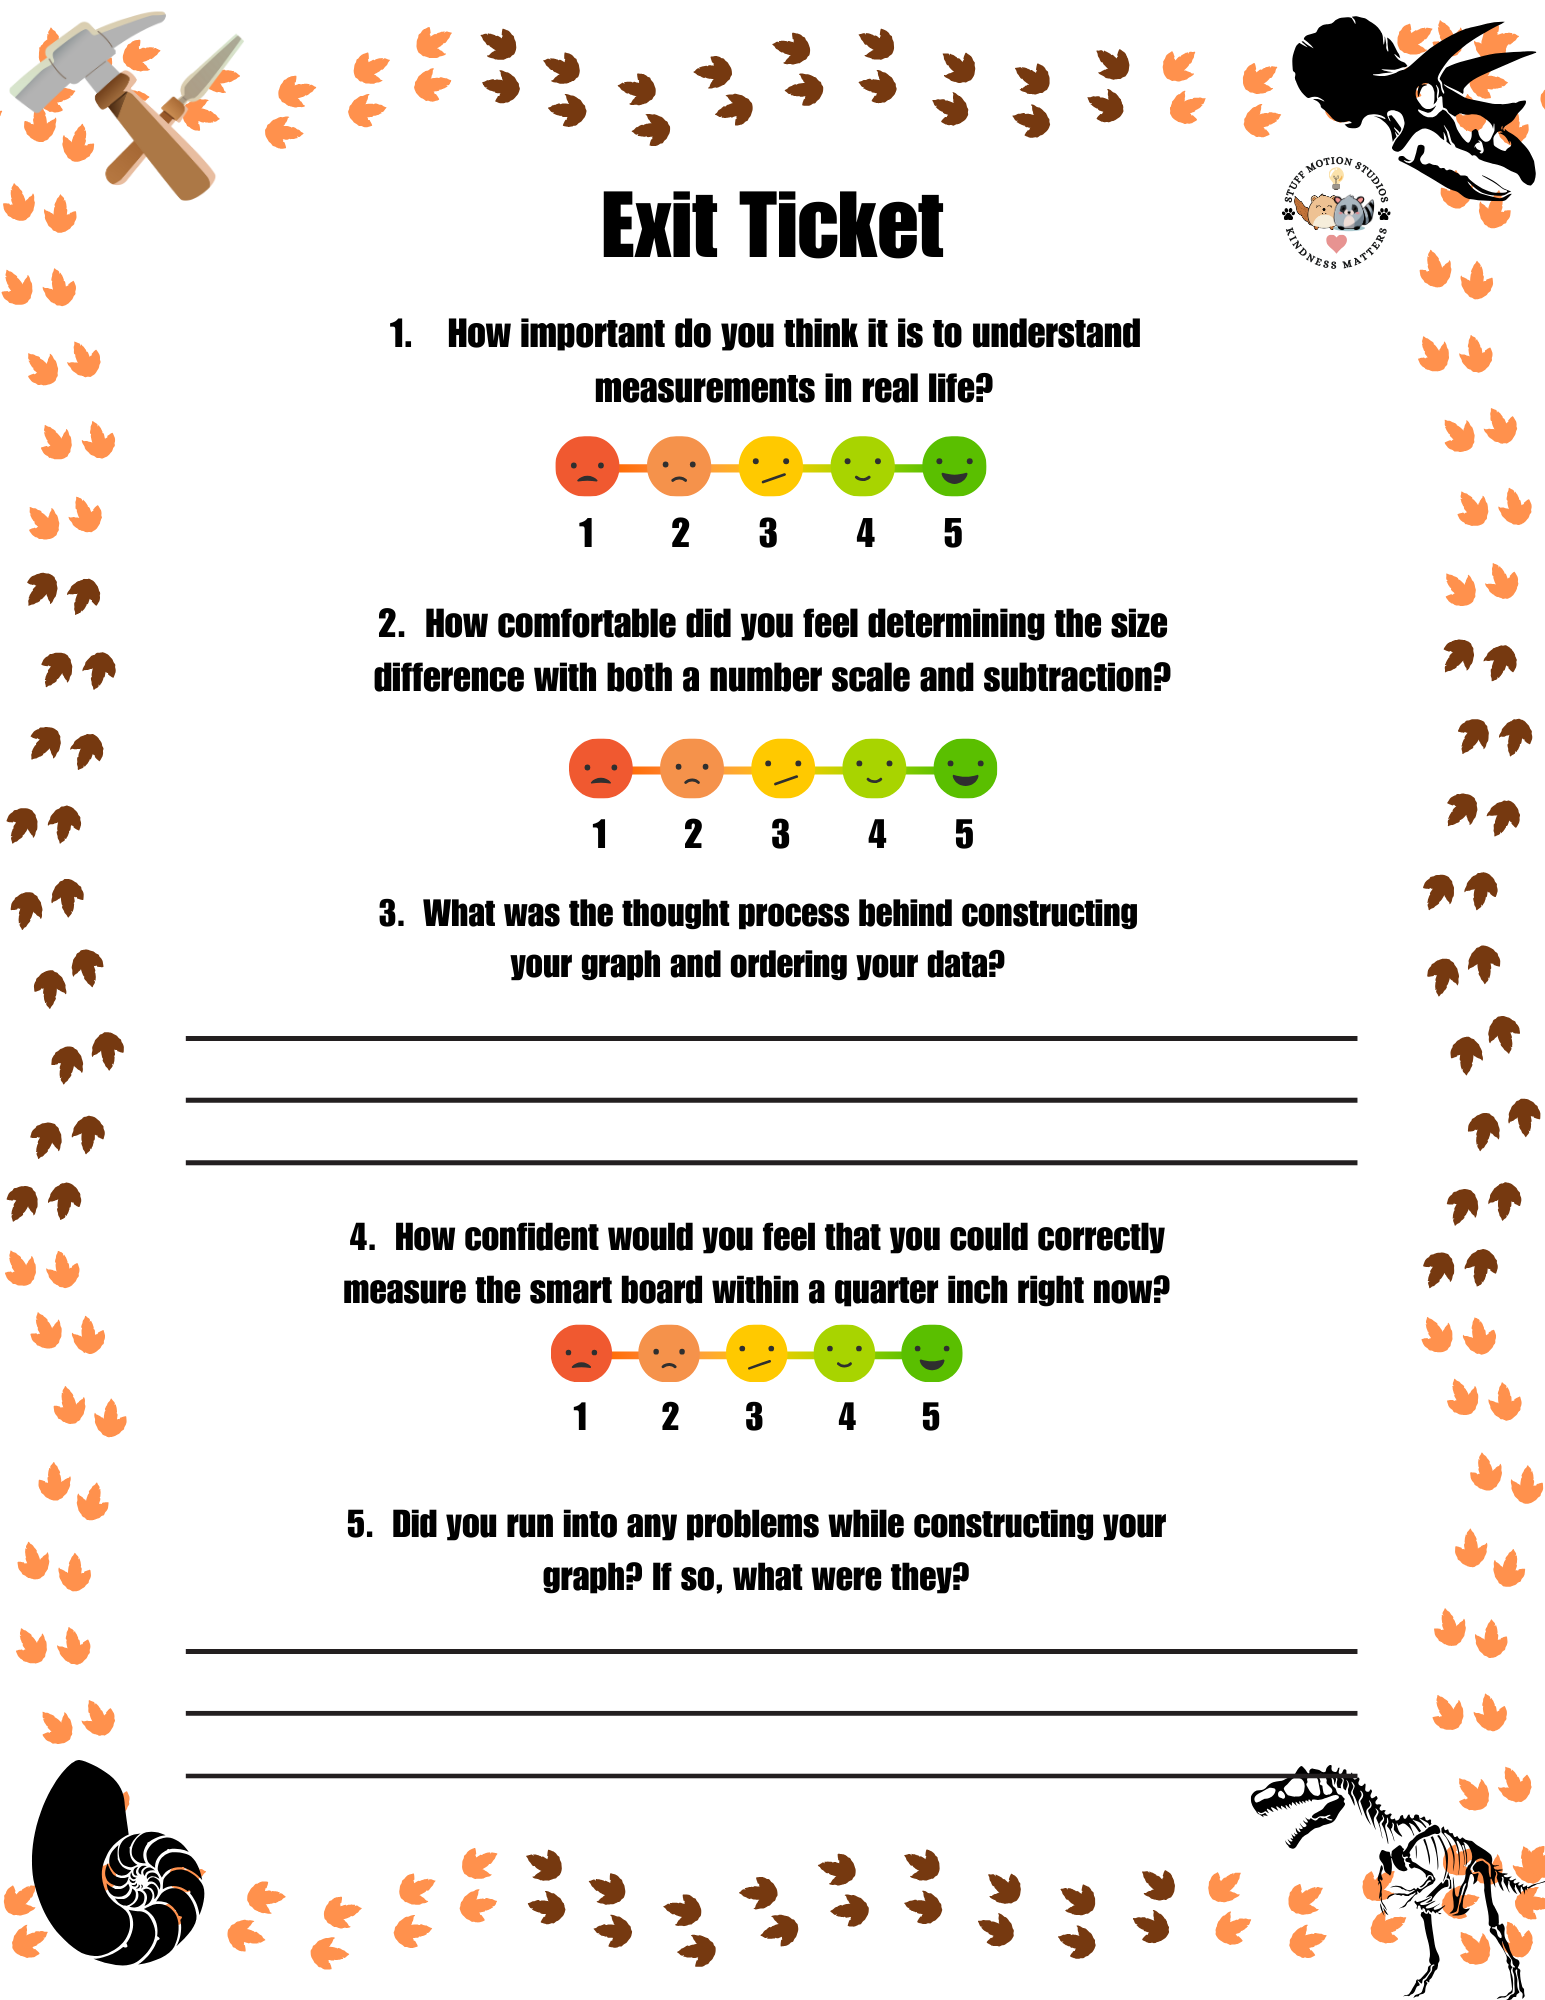
- Assessment: Students will complete the provided exit ticket (download below) about their experience during the activity.
Materials:
- Lesson Hook Video
- Presentation (see section below to download)
- Device to display video and presentation
- Buckets (1 per group)
- Dirt/sand (enough for all groups)
- Fossils (5 per group – Any object can represent a fossil. There are printable fossils below that can be printed on cardstock and/or laminated. Links to free 3D Print files are located in the lesson plan as well.)
- Excavation tools – Brushes and/or shovels (1-5 per group)
- Rulers (5 per group)
- Lab sheets (5 per group)
- Pencils/erasers (5 per group)
- Exit Tickets (5 per group)
Presentation & Lesson Aids – Free Downloads
In this lesson you will find:
- The engaging lesson introduction video above
- A full lesson plan aligned with educational standards
- A teaching presentation that guides you through every aspect of the lesson and activity
- Lab sheets for students to complete during the activity (there is a general version and one modified for English Language Learners and students with IEP plans)
- Exit tickets to assess students’ understanding of the activity, as well as the Five Strands of Mathematical Proficiency (there is a general version and one modified for English Language Learners and students with IEP plans)
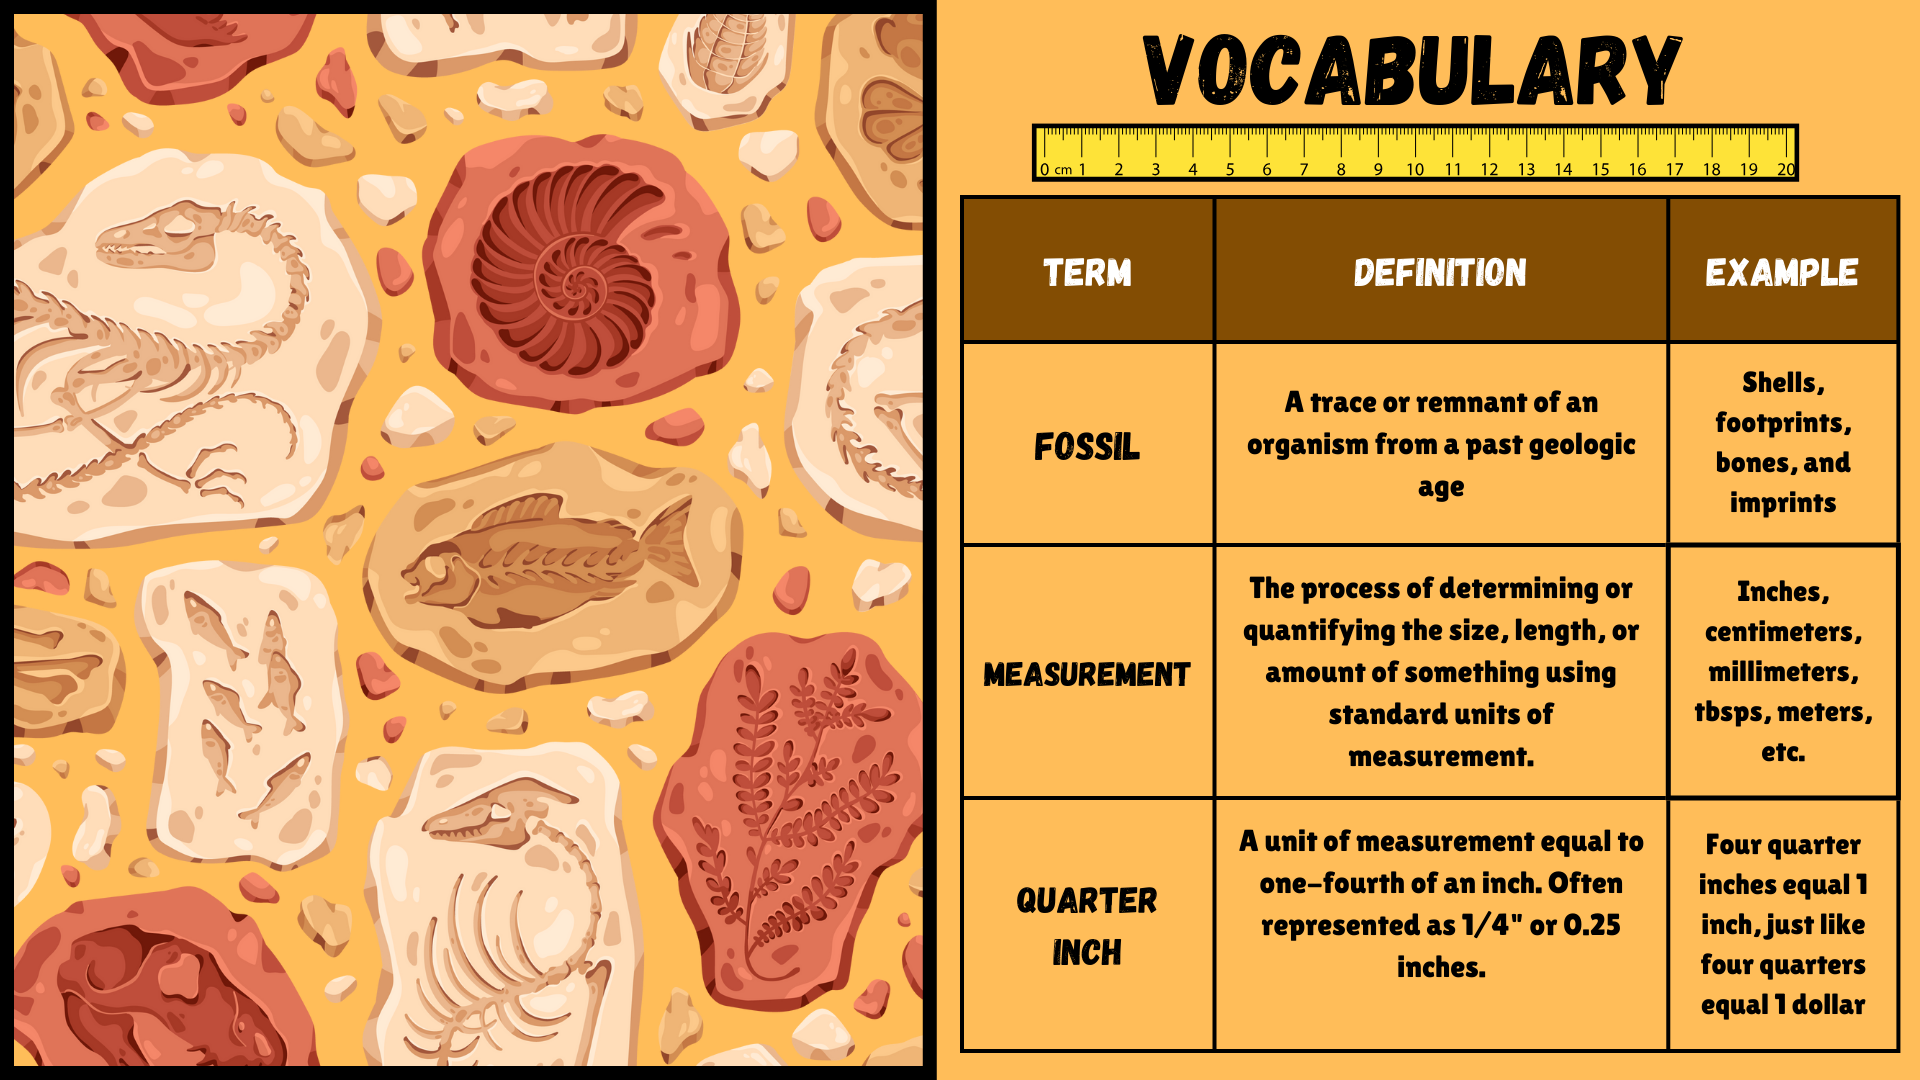
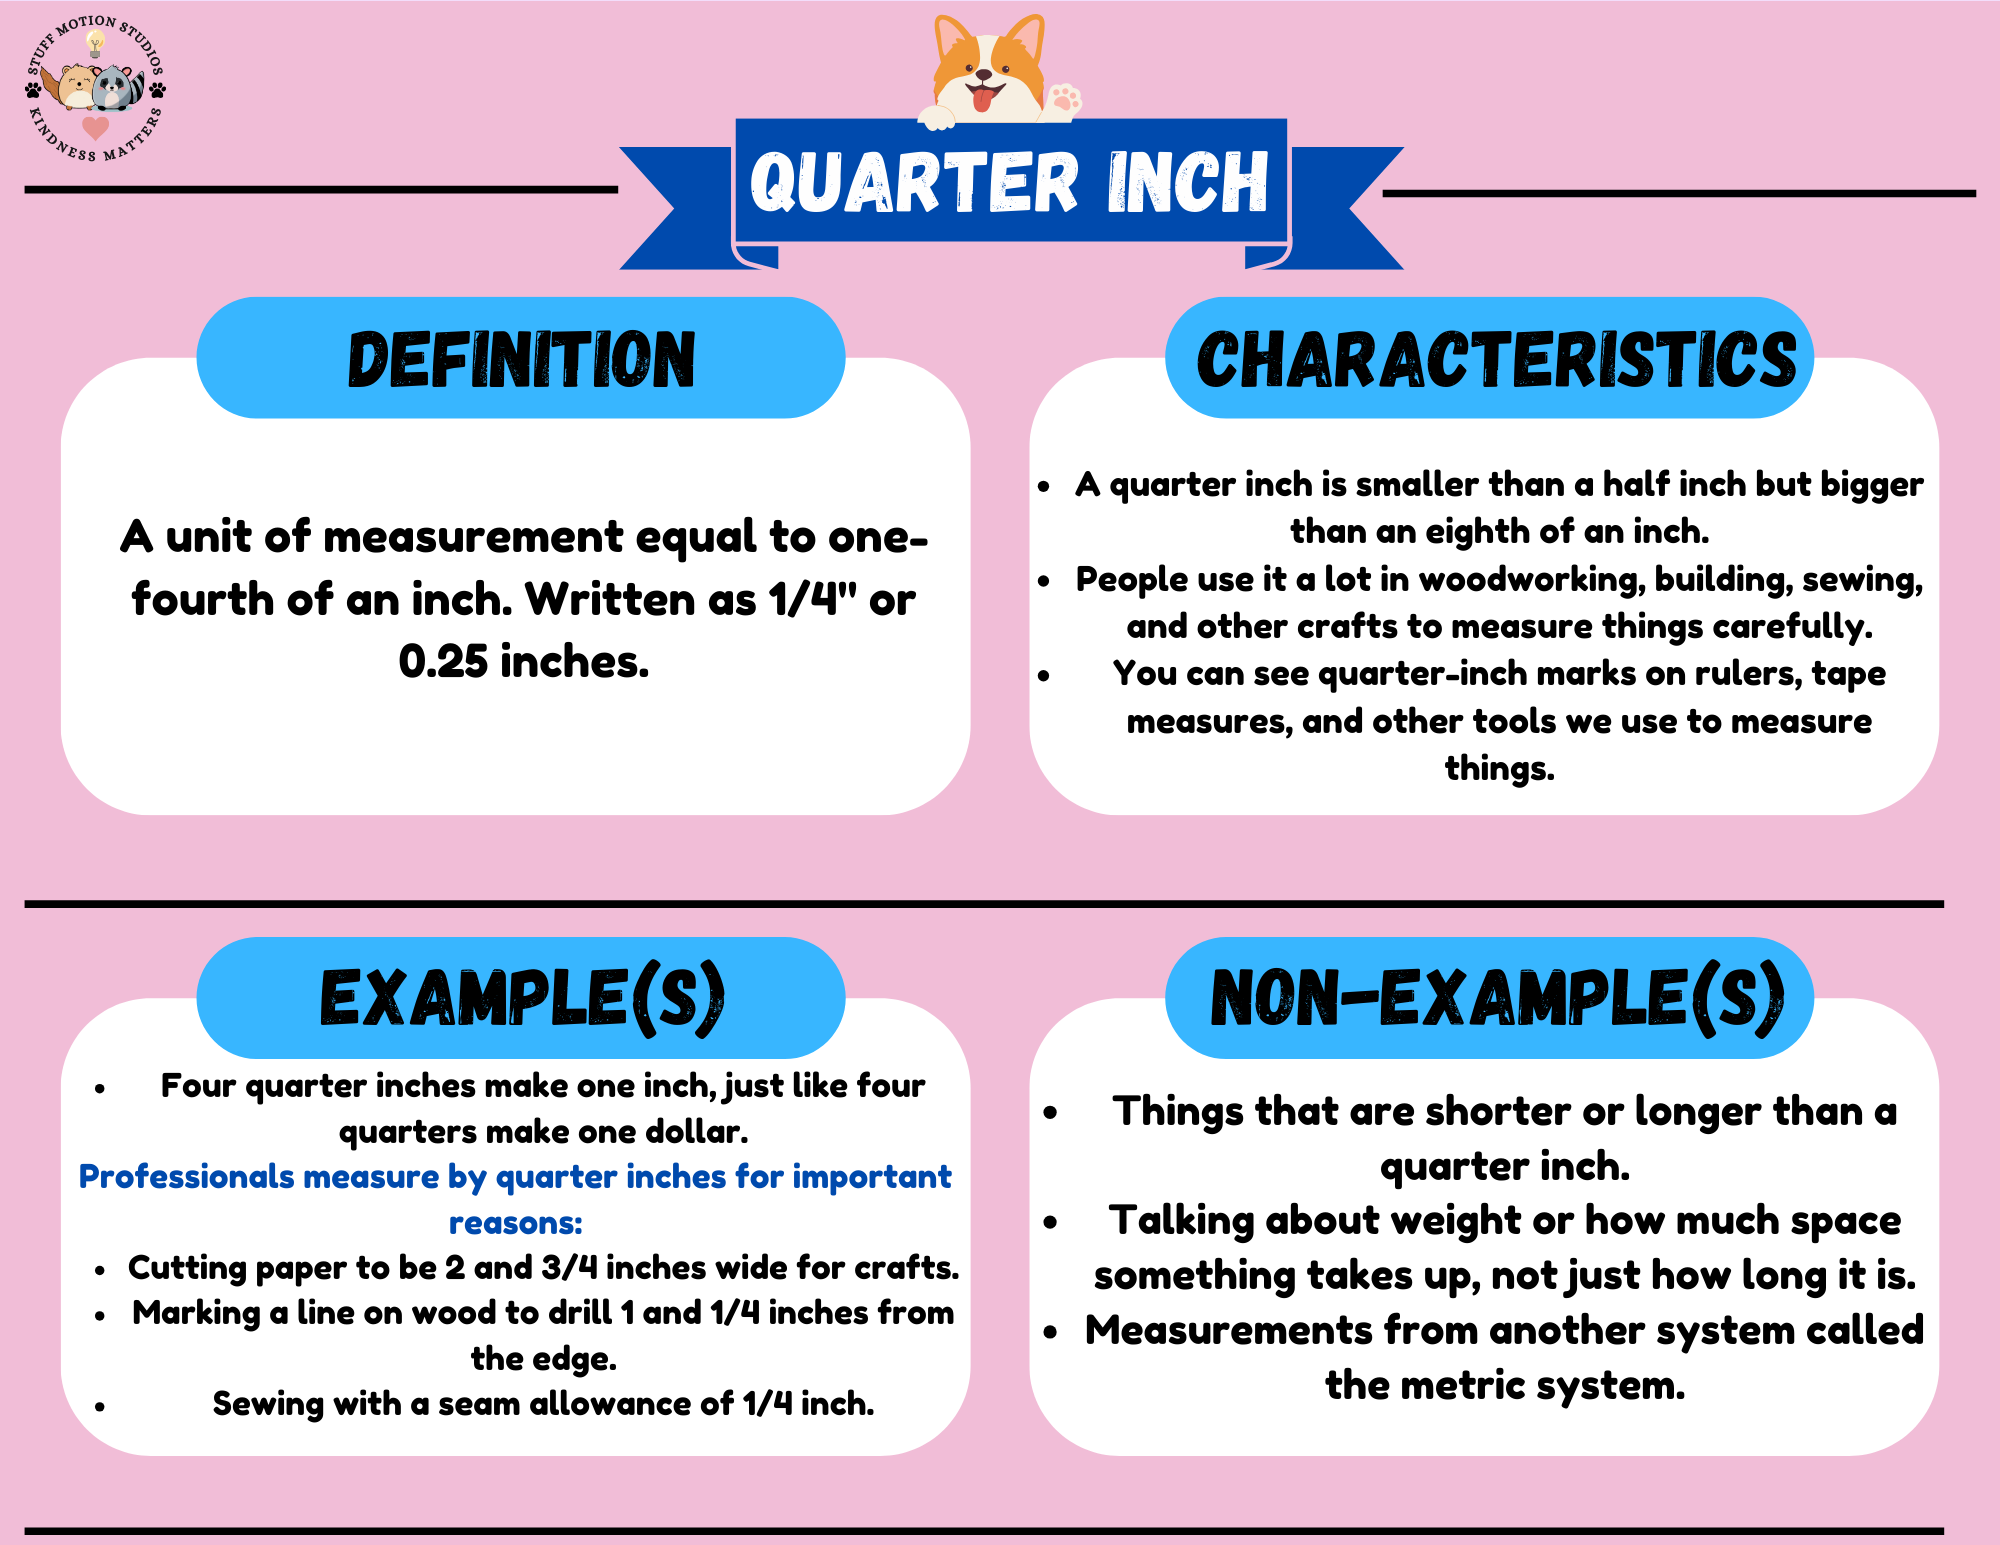
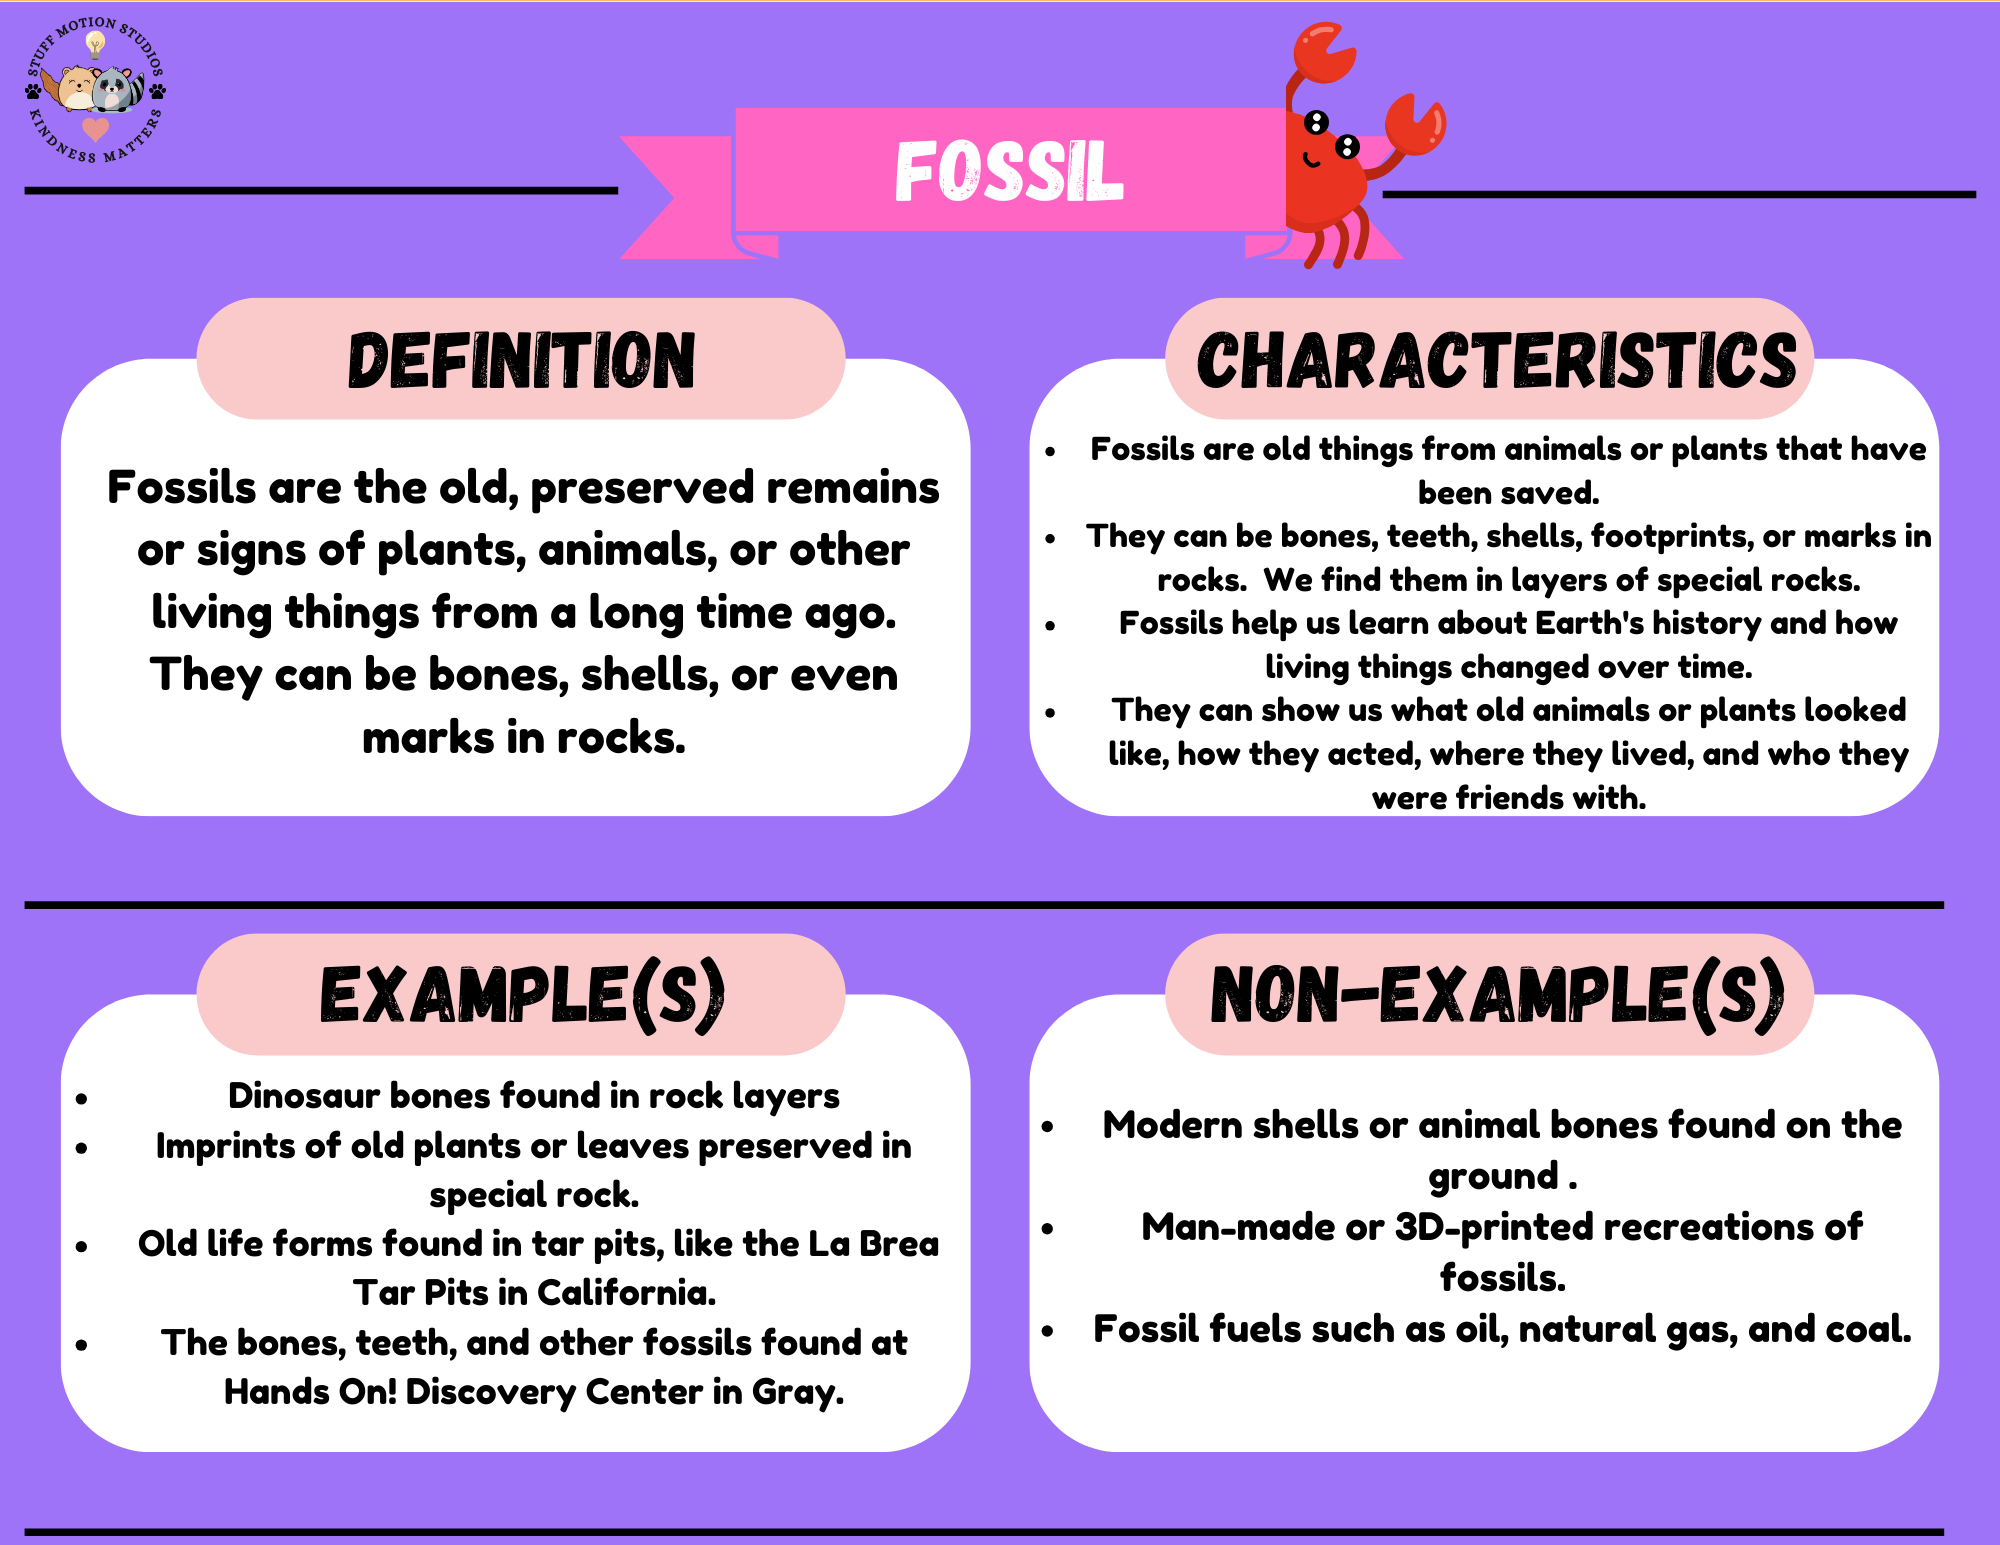
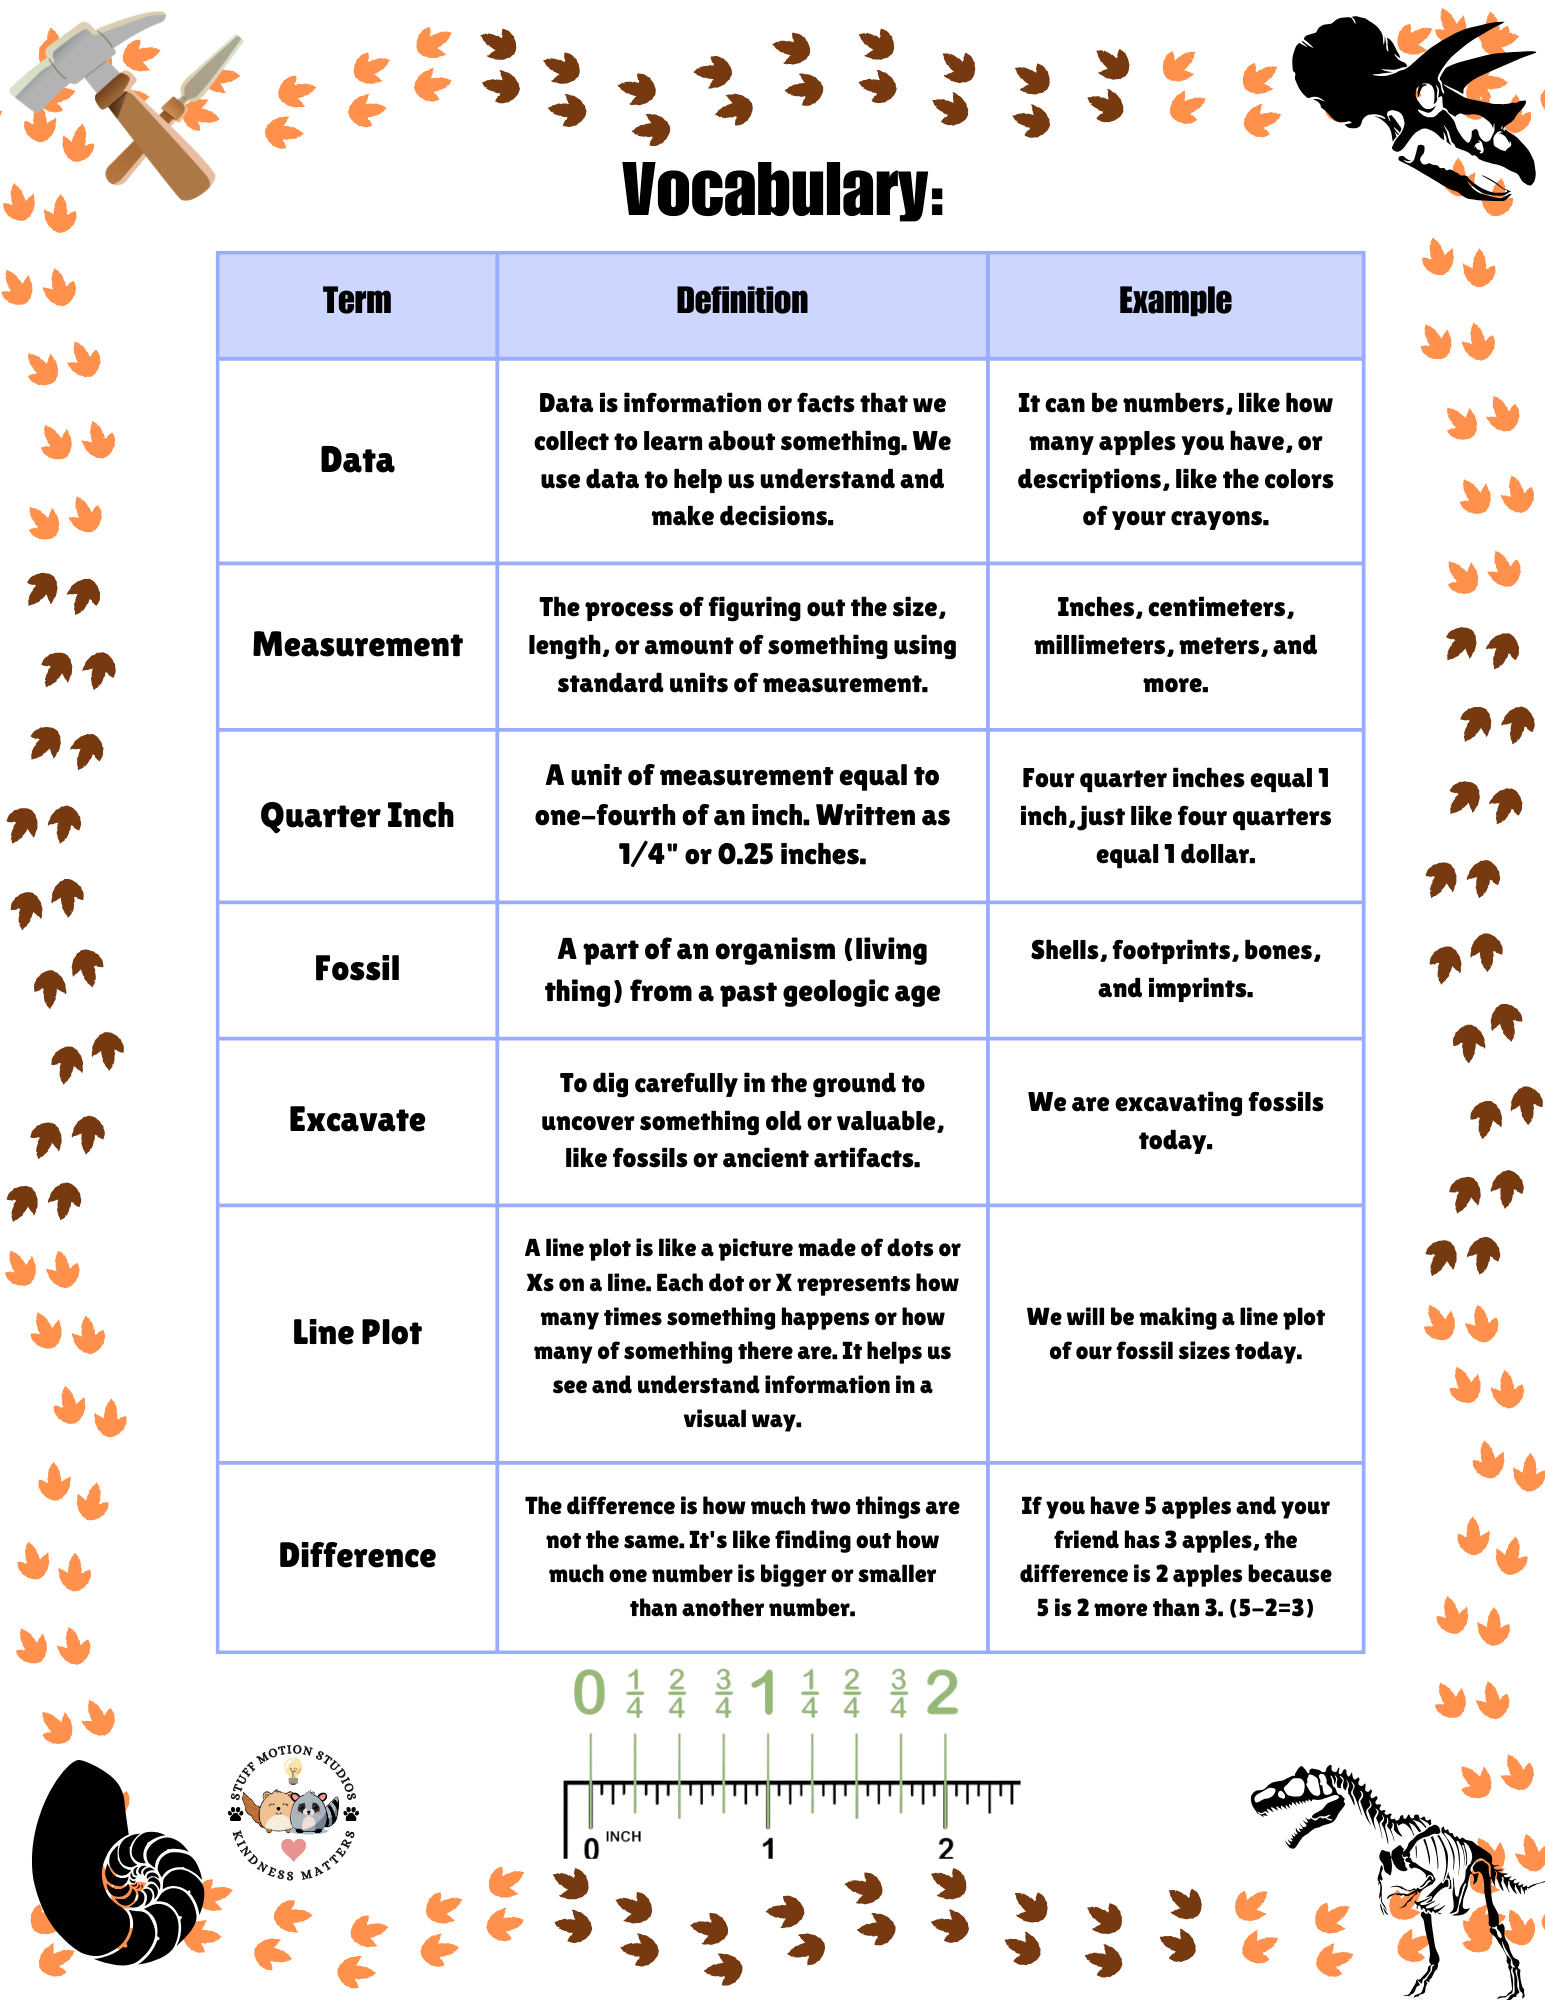
- Frayer Square word wall printables (there is a general version and one modified for English Language Learners and students with IEP plans)
- Printable fossils to use in the activity
- A concept map of the Tennessee state standards clusters from kindergarten through fifth grade.
- A cross-curricular concept map illustrating the aspects of fossils that tie into the disciplines of math and science.
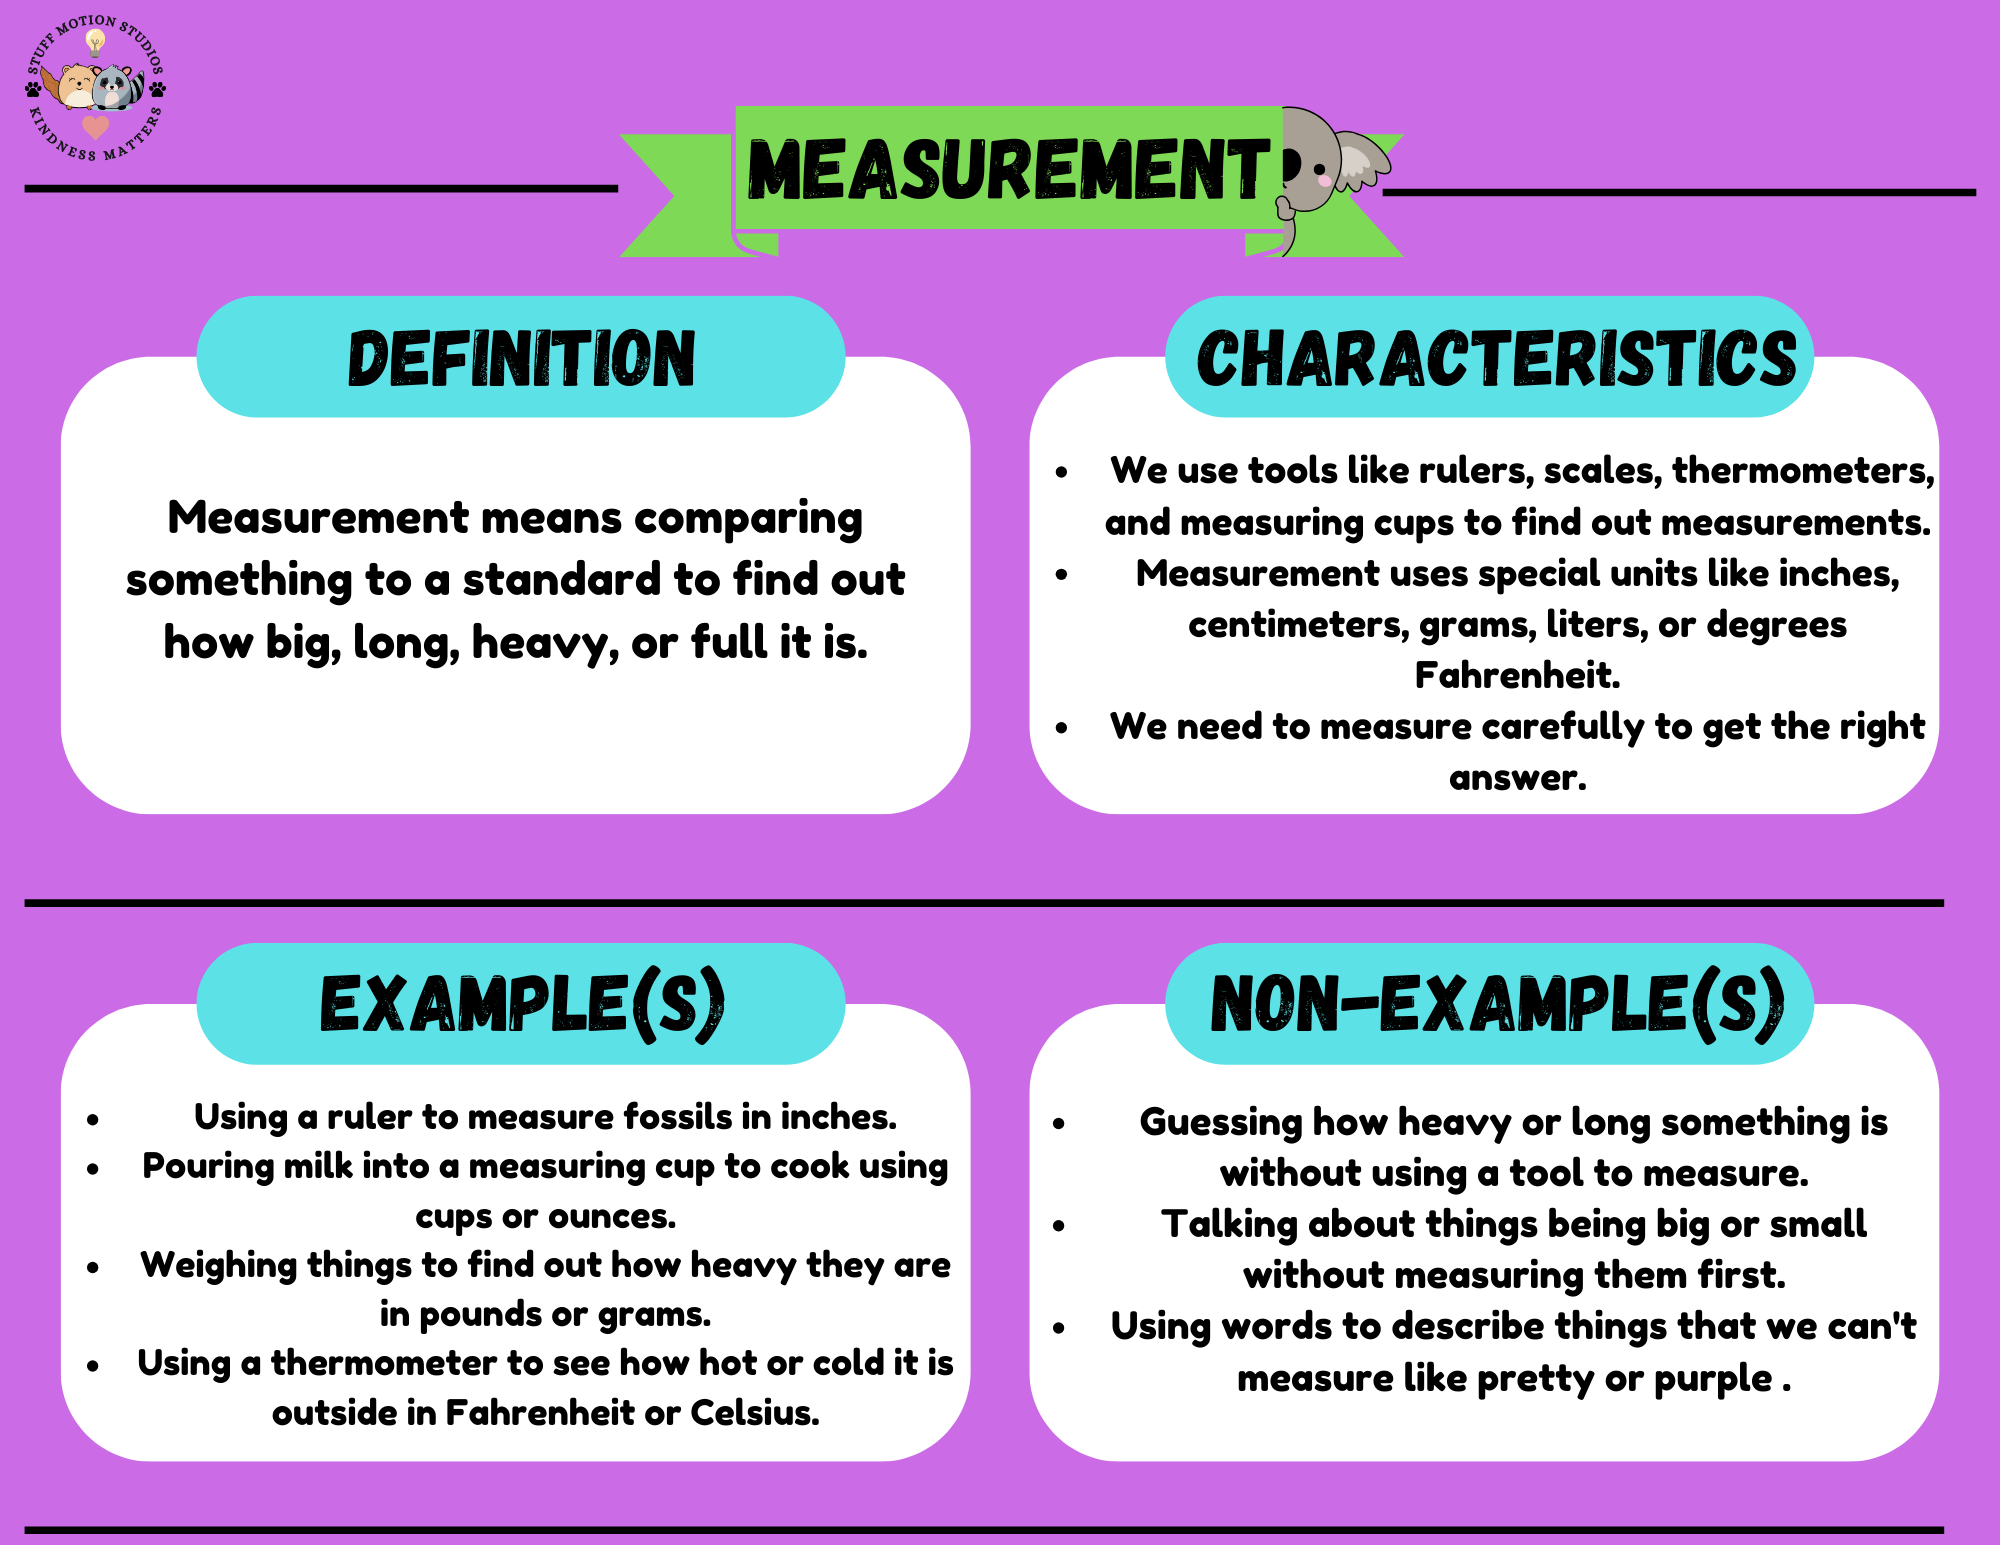
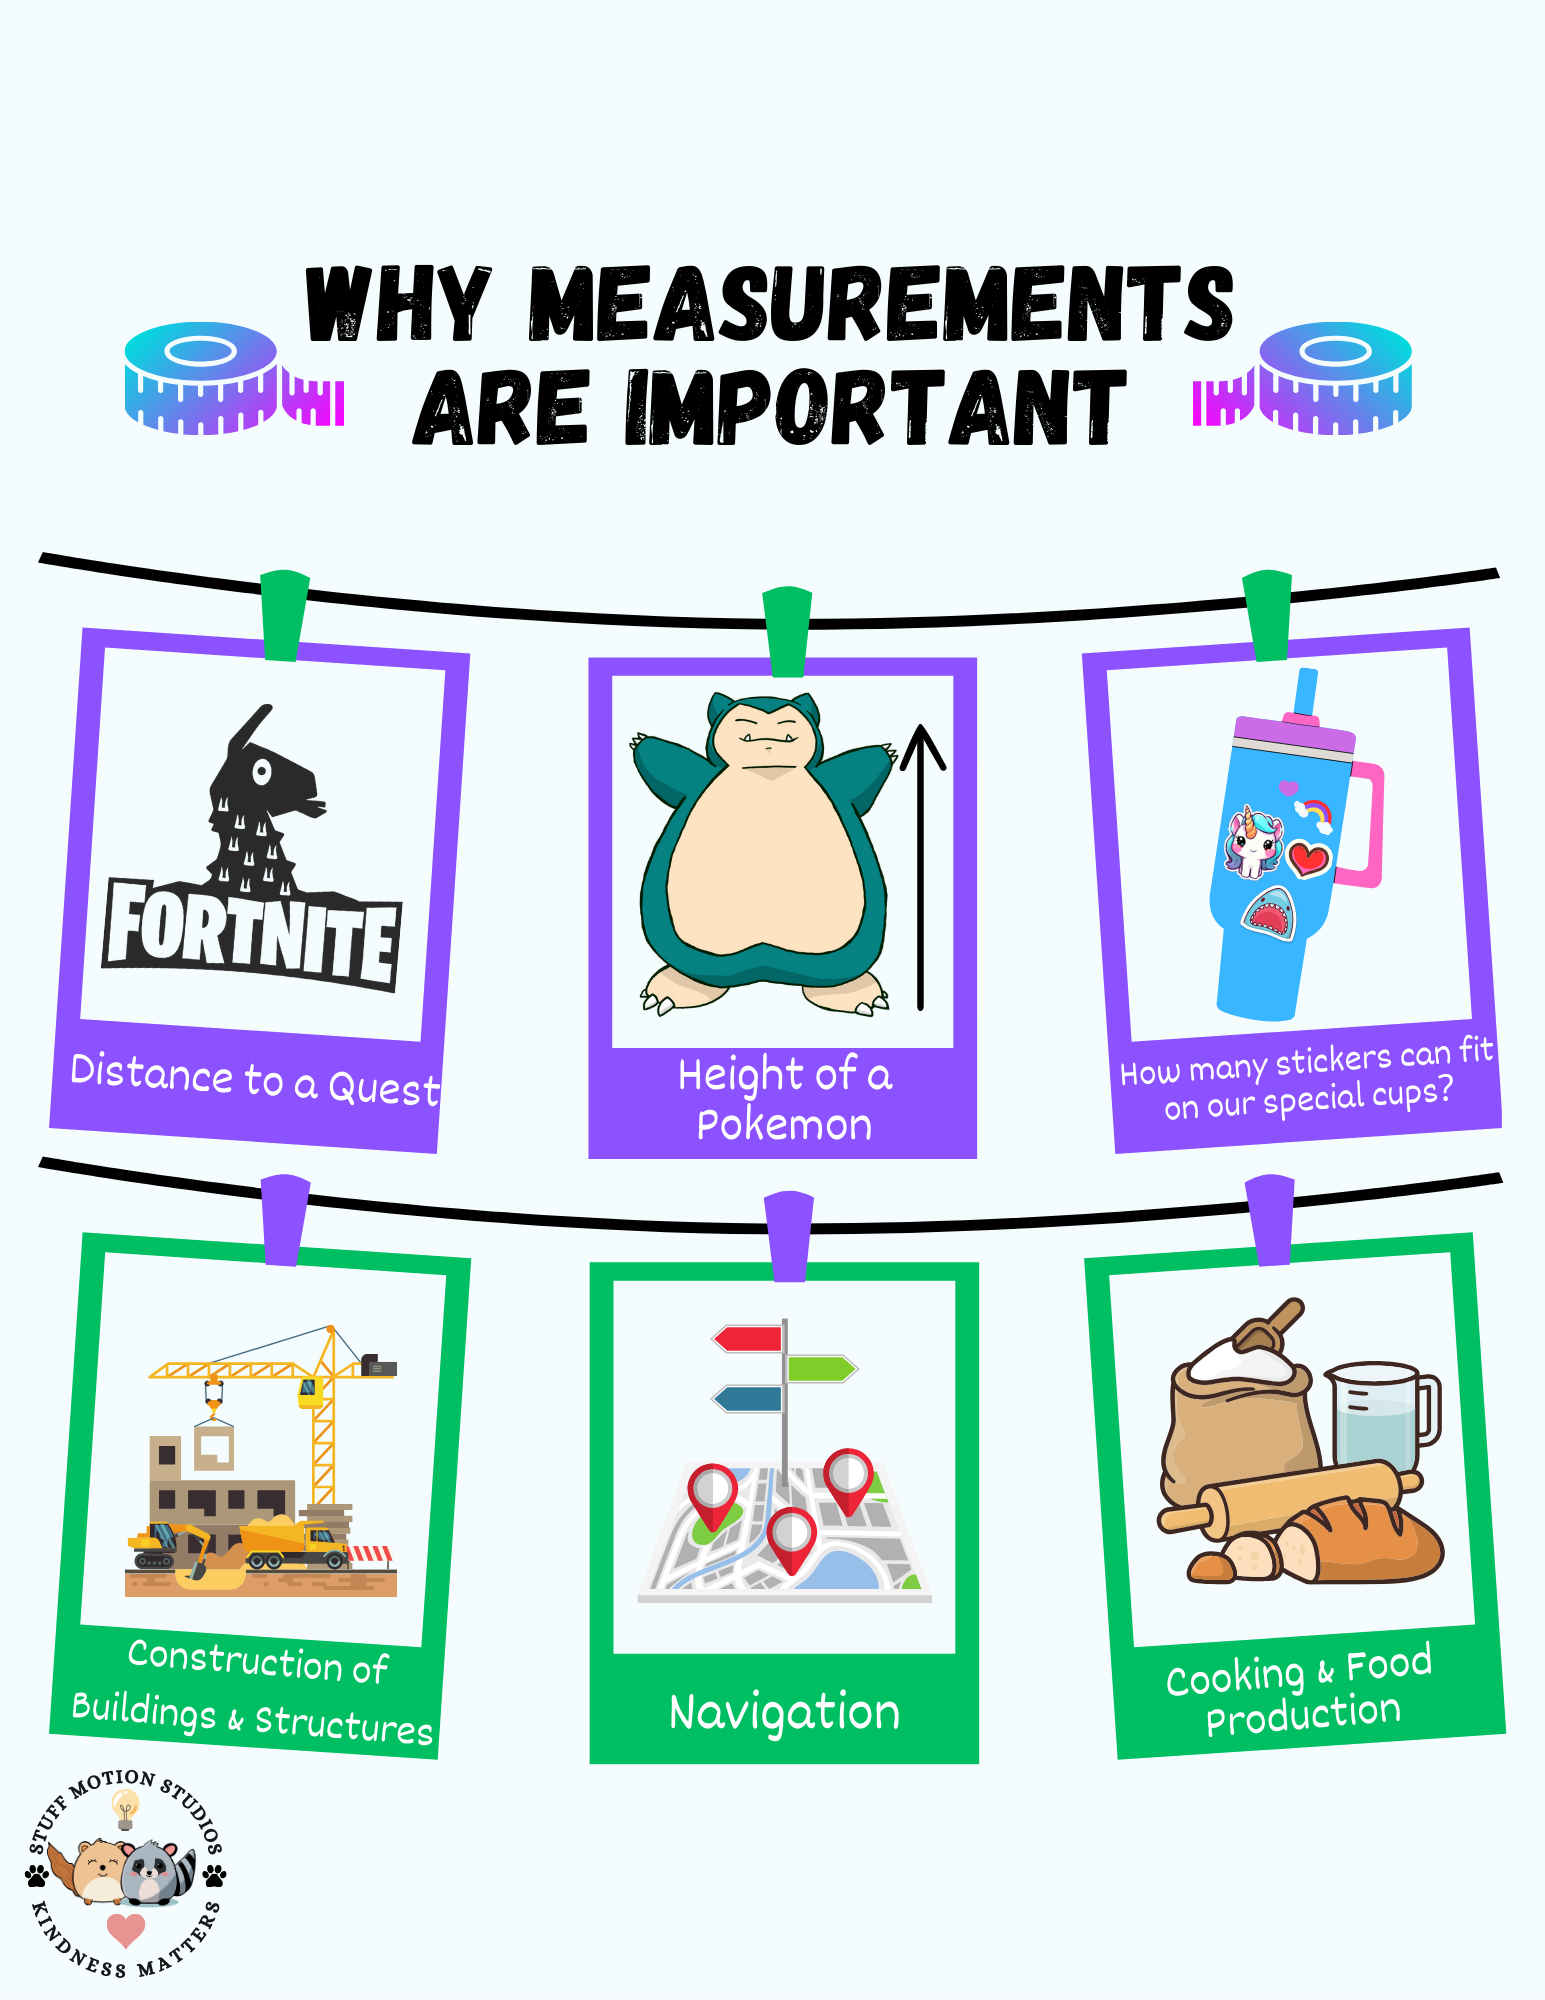
- A graphic organizer illustrating the importance of measurement in ways that kids will relate to, as well as real-world examples.


Canva Link to Teaching Presentation: https://www.canva.com/design/DAGDYfrKsVk/kxu4MBJvvmb_kDVBeVQdsg/edit?utm_content=DAGDYfrKsVk&utm_campaign=designshare&utm_medium=link2&utm_source=sharebutton
